Updated January 23, 2019 with infographic on the FBI source of local crime data used to develop the lists.
Each year, the FBI’s Uniform Crime Reporting Program (UCR) releases crime rates per 100,000 inhabitants in the United States. The 2017 data, released earlier in 2018, addresses both violent crimes and property crimes independently. Using the data collected we updated our FBI’s 10 Most Dangerous Cities list by solving for violent crimes reported, and ranking the top 10 most dangerous cities in each of the four U.S. Census Bureau regions.
Dividing the list by region for the update may provide a better understanding of the violence experience in higher population centers across a region. We felt for this update it was a fairer way to rank cities because the utility of the FBI’s UCR data is waning.
Some cities, like Detroit, have switched to reporting their crime data to the FBI’s newer National Incident-Based Reporting System (NIBRS), which the FBI plans to switch over to for crime reporting in January 2021.
Thus, numerous cities with populations of 100,000 didn’t report their 2017 crime data, or stopped reporting to the voluntary UCR system after 2016, such as Jersey City, New Jersey.
According to the FBI, murder, rape, robbery and aggravated assault fall under violent crime. Our updated FBI’s most dangerous cities lists are based on violent crimes reported in the first 6 months of 2017.
For this update, we dropped the property crime data and pulled in the UCR’s murder rate data to offer greater insight to our regional lists of FBI’s 10 Most Dangerous Cities, and to respond to comments on social media about Chicago not appearing on our 2016 list. The Windy City appears as #7 on The Top 10 Most Dangerous Cities in the Midwest list below, based on a regional review of the 2017 data.
Nationwide:
- Baltimore, Md., had the highest reported violent crime rate per 100,000 inhabitants
- St. Louis, Mo., had the highest reported murder rate per 100,000 inhabitants
Explore the top 10 most dangerous cities lists in the four U.S. regions:
FBI’s Top 10 Most Dangerous Cities in the West
The top 10 most dangerous cities in region 4, and their populations, are:
- Stockton, Calif., pop. 308,348
- San Bernardino, Calif., pop. 217,303
- Oakland, Calif., pop. 424,998
- Anchorage, Alaska, pop. 299,097
- Pueblo, Colo., pop. 109,927
- Modesto, Calif., pop. 212,880
- Richmond, Calif., pop. 110,868
- Vallejo, Calif., pop. 122,293
- Inglewood, Calif., pop. 112,059
- Tacoma, Wash., pop. 209,914
Cities in Wyoming did not report.
FBI’s Top 10 Most Dangerous Cities in the South
The top 10 most dangerous cities in region 3, and their populations, are:
- Baltimore, Md., pop. 618,385
- Memphis, Tenn., pop. 656,434
- Little Rock, Ark., pop. 198,800
- Nashville, Tenn., pop. 668,685
- New Orleans, La., pop. 397,208
- Chattanooga, Tenn., pop. 177,801
- Baton Rouge, La., pop. 228,389
- Tulsa, Oklahoma, pop. 405,748
- West Palm Beach, Fla., pop. 108,074
- Tallahassee, Fla., 191,564
Cities in Delaware, Mississippi, North Carolina, West Virginia and Texas and Washington D.C. did not report.
FBI’s Top 10 Most Dangerous Cities in the Midwest
The top 10 most dangerous cities in region 2, and their populations, are:
- St. Louis, Mo., pop. 314,507
- Kansas City, Mo., pop. 478,364
- Rockford, Ill., pop. 147,363
- Milwaukee, Wisc., pop. 600,193
- Minneapolis, Minn., pop. 416,751
- Lansing, Mich., pop. 115,199
- Chicago, Ill., pop. 2,725,153
- South Bend, Ind., pop. 101,621
- Cincinnati, Ohio, pop. 298,880
- Dayton, Ohio, pop. 140,260
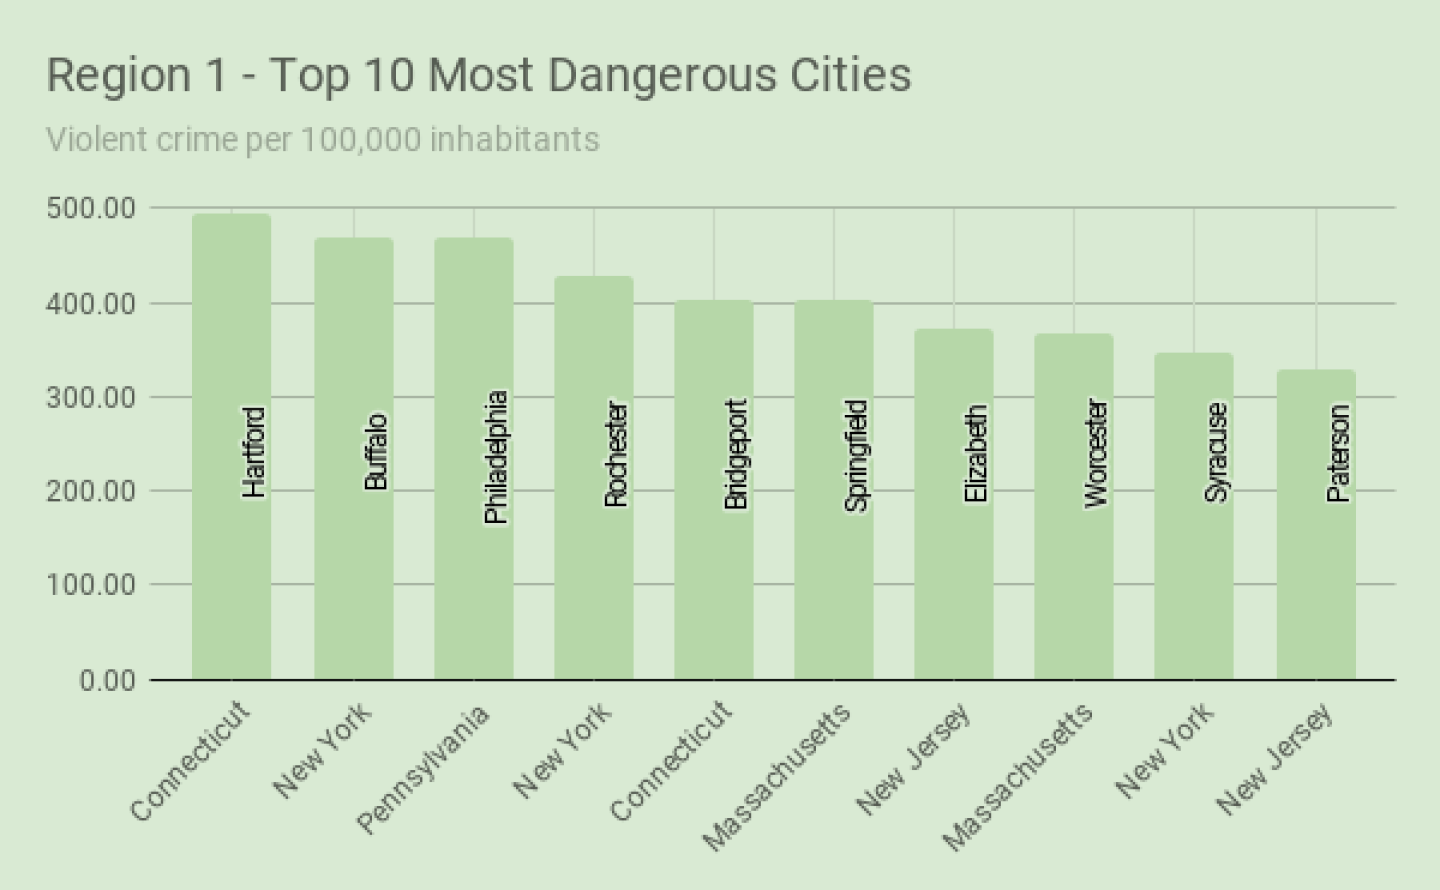
FBI’s Top 10 Most Dangerous Cities in the Northeast
The top 10 most dangerous cities in region 1, and their populations, are:
- Hartford, Conn., pop. 123,736
- Buffalo, N.Y., pop. 257,446
- Philadelphia, Penn., pop. 1,570,826
- Rochester, N.Y., pop. 209,643
- Bridgeport, Conn., pop. 148,180
- Springfield, Mass., pop. 154,102
- Elizabeth, N.J., pop. 129,096
- Worcester, Mass., pop. 184,595
- Syracuse, N.Y., pop. 143,925
- Paterson, N.J., pop. 147,265
Cities in Maine, Rhode Island and Vermont did not report.
Future FBI’s Most Dangerous Cities Lists
Our sorted data set includes information about which states in each region did not have any cities reporting, and also indicates which cities reporting in 2016 did not report in 2017.
The FBI released the 2017 NIBRS data earlier this month.
The FBI indicates that 43 percent of law enforcement agencies are reporting through NIBRS, and that data has been added to FBI’s Crime Data Explorer, a tool that can search crime reporting data by location.
Access the NIBRS 2017 reporting map on FBI.gov.
Review our sorted FBI UCR 2017 data in Google Sheets.
Understand the UCR program’s purpose and limitations on Police1.com.


